WerkIQ Analytics

Turn Business Data into Smarter Decisions

Monitor performance, uncover insights, and make data-driven decisions with powerful dashboards, real-time reporting, and advanced analytics. WerkIQ Analytics brings your business data together in one place so you can measure what matters most.

WerkIQ Analytics
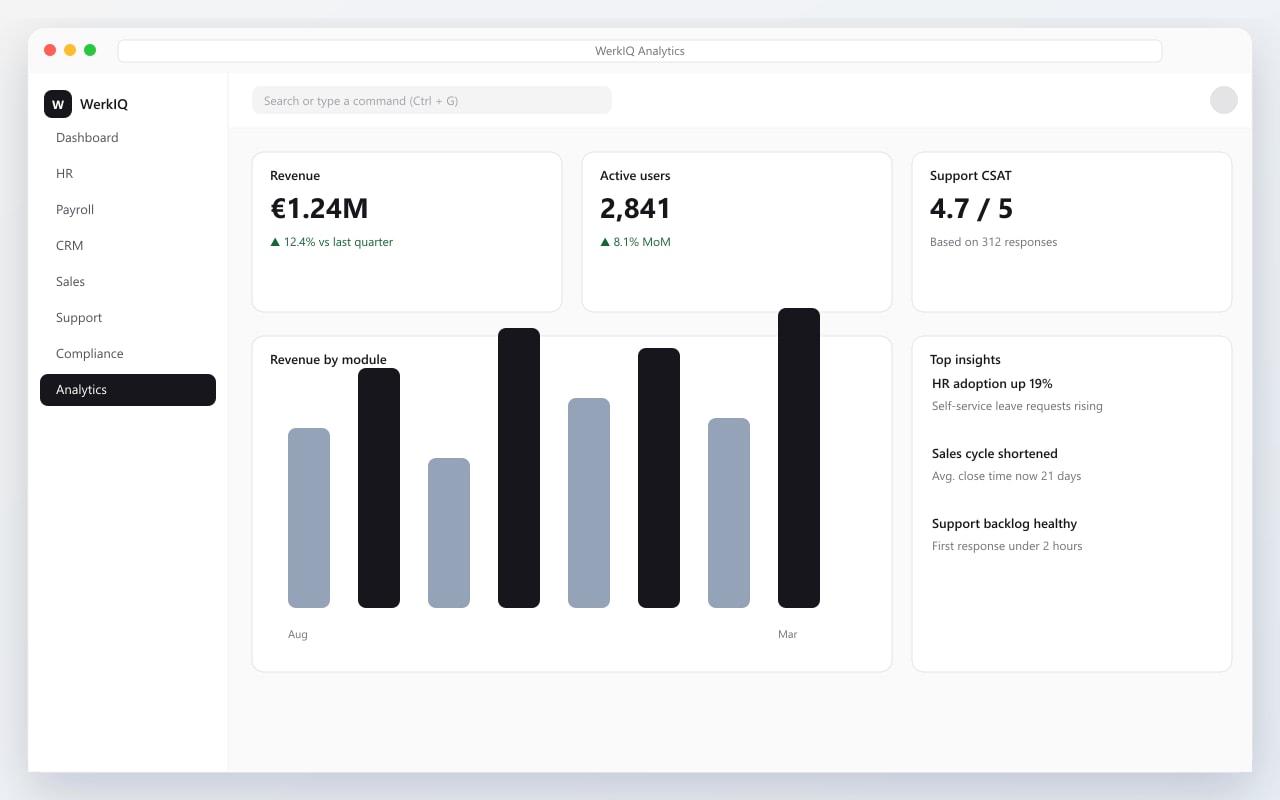
WerkIQ Analytics dashboard with revenue charts and key insights
See the Bigger Picture

Data is only valuable when it helps you make better decisions.

WerkIQ Analytics transforms information from across your organization into interactive dashboards, detailed reports, and actionable insights. Whether you're tracking sales performance, workforce productivity, customer support metrics, or website engagement, you'll always have the data you need when you need it.

How it works

A clear path through WerkIQ Analytics

Each step stays connected, so information moves forward without re-entry, hidden handoffs, or separate spreadsheets.

  1. 1

    Interactive Dashboards

    Visualize your business with customizable dashboards.

    Drag-and-drop dashboard builder

  2. 2

    Real-Time Reporting

    Access live business data instantly.

    Live reports

  3. 3

    Key Performance Indicators (KPIs)

    Track the metrics that drive your business.

    Custom KPIs

  4. 4

    Business Intelligence

    Gain deeper insights into your operations.

    Trend analysis

Everything You Need to Analyze Your Business

Interactive Dashboards

Visualize your business with customizable dashboards.

  • Drag-and-drop dashboard builder
  • KPI widgets
  • Charts & graphs
  • Tables
  • Scorecards
  • Filters
  • Drill-down analysis
  • Custom layouts
  • Shared dashboards

Real-Time Reporting

Access live business data instantly.

  • Live reports
  • Scheduled reports
  • Saved reports
  • Report templates
  • Report exports
  • Custom report builder
  • Cross-module reporting
  • Data filtering

Key Performance Indicators (KPIs)

Track the metrics that drive your business.

  • Custom KPIs
  • Goal tracking
  • Progress indicators
  • Performance scorecards
  • Department KPIs
  • Company-wide KPIs
  • Trend analysis

Business Intelligence

Gain deeper insights into your operations.

  • Trend analysis
  • Performance comparisons
  • Forecasting
  • Data segmentation
  • Business insights
  • Historical analysis
  • Growth tracking

Data Visualization

Understand complex data at a glance.

  • Line charts
  • Bar charts
  • Pie charts
  • Heat maps
  • Geographic maps
  • Funnel charts
  • Pivot tables
  • Custom visualizations

Cross-Platform Analytics

Connect data across the WerkIQ ecosystem.

  • HR analytics
  • Sales analytics
  • Support analytics
  • Website analytics
  • Combined business dashboards
  • Department comparisons
  • Organization-wide reporting

Automated Reports

Deliver reports automatically.

  • Scheduled reports
  • Email delivery
  • PDF exports
  • Excel exports
  • CSV exports
  • Shared dashboards
  • Report subscriptions

Goal & Performance Tracking

Stay focused on business objectives.

  • Business goals
  • Department objectives
  • Team performance
  • Target tracking
  • Progress monitoring
  • Milestone tracking

Data Management

Maintain clean and reliable business data.

  • Data validation
  • Data cleansing
  • Data synchronization
  • Import & export
  • Historical records
  • Data retention policies

Automate

Intelligent Analytics

Go beyond reporting with smarter insights.

  • Daily business reports
  • Executive summaries
  • KPI alerts
  • Threshold notifications
  • Weekly performance reports
  • Monthly business reviews
  • Automated dashboard updates
  • Scheduled data refresh
  • Performance anomaly alerts

Reports Across Every Department

HR Analytics

Track workforce performance.

Reports

  • Headcount
  • Employee growth
  • Attendance trends
  • Leave analysis
  • Payroll overview
  • Employee turnover
  • Performance reviews

Sales Analytics

Measure sales success.

Reports

  • Revenue
  • Sales pipeline
  • Conversion rates
  • Win/Loss analysis
  • Top-performing products
  • Sales representative performance
  • Customer acquisition

Support Analytics

Improve customer service.

Reports

  • Ticket volume
  • Response time
  • Resolution time
  • SLA compliance
  • Customer satisfaction
  • Agent productivity
  • Ticket trends

Website Analytics

Monitor digital performance.

Reports

  • Website traffic
  • User sessions
  • Popular pages
  • Conversion rate
  • Form submissions
  • Traffic sources
  • Device usage

Why Choose WerkIQ Analytics

One Source of Truth

Bring together data from every WerkIQ product into a unified view.

Real-Time Insights

Monitor business performance as it happens.

Customizable Dashboards

Build dashboards tailored to your team and business goals.

Executive Reporting

Provide leadership with clear, actionable insights.

Scalable Analytics

From startup metrics to enterprise reporting, WerkIQ Analytics grows with your business.

Secure by Design

Protect sensitive business data with enterprise-grade security and role-based access controls.

Integrations

Analyze data from your entire technology stack.

Swipe or use arrows to browse integrations

Microsoft 365
Google Workspace
Slack
Stripe
GitHub
ERP systems
LDAP / SSO
REST API
Webhooks
Email services

Features

Security & Governance

Ensure your data remains secure and compliant.

  • Role-based permissions
  • Data encryption
  • Audit logs
  • Single Sign-On (SSO)
  • Two-factor authentication
  • Data retention controls
  • Access monitoring

Frequently Asked Questions

Yes. Build dashboards using drag-and-drop widgets, charts, KPIs, and filters to match your business needs.

Make Every Decision Backed by Data

Empower your organization with real-time analytics, interactive dashboards, and intelligent reporting that turn business data into meaningful action.

Prefer to talk live? Book a meeting on Cal.com